Daily instruction before complexity.
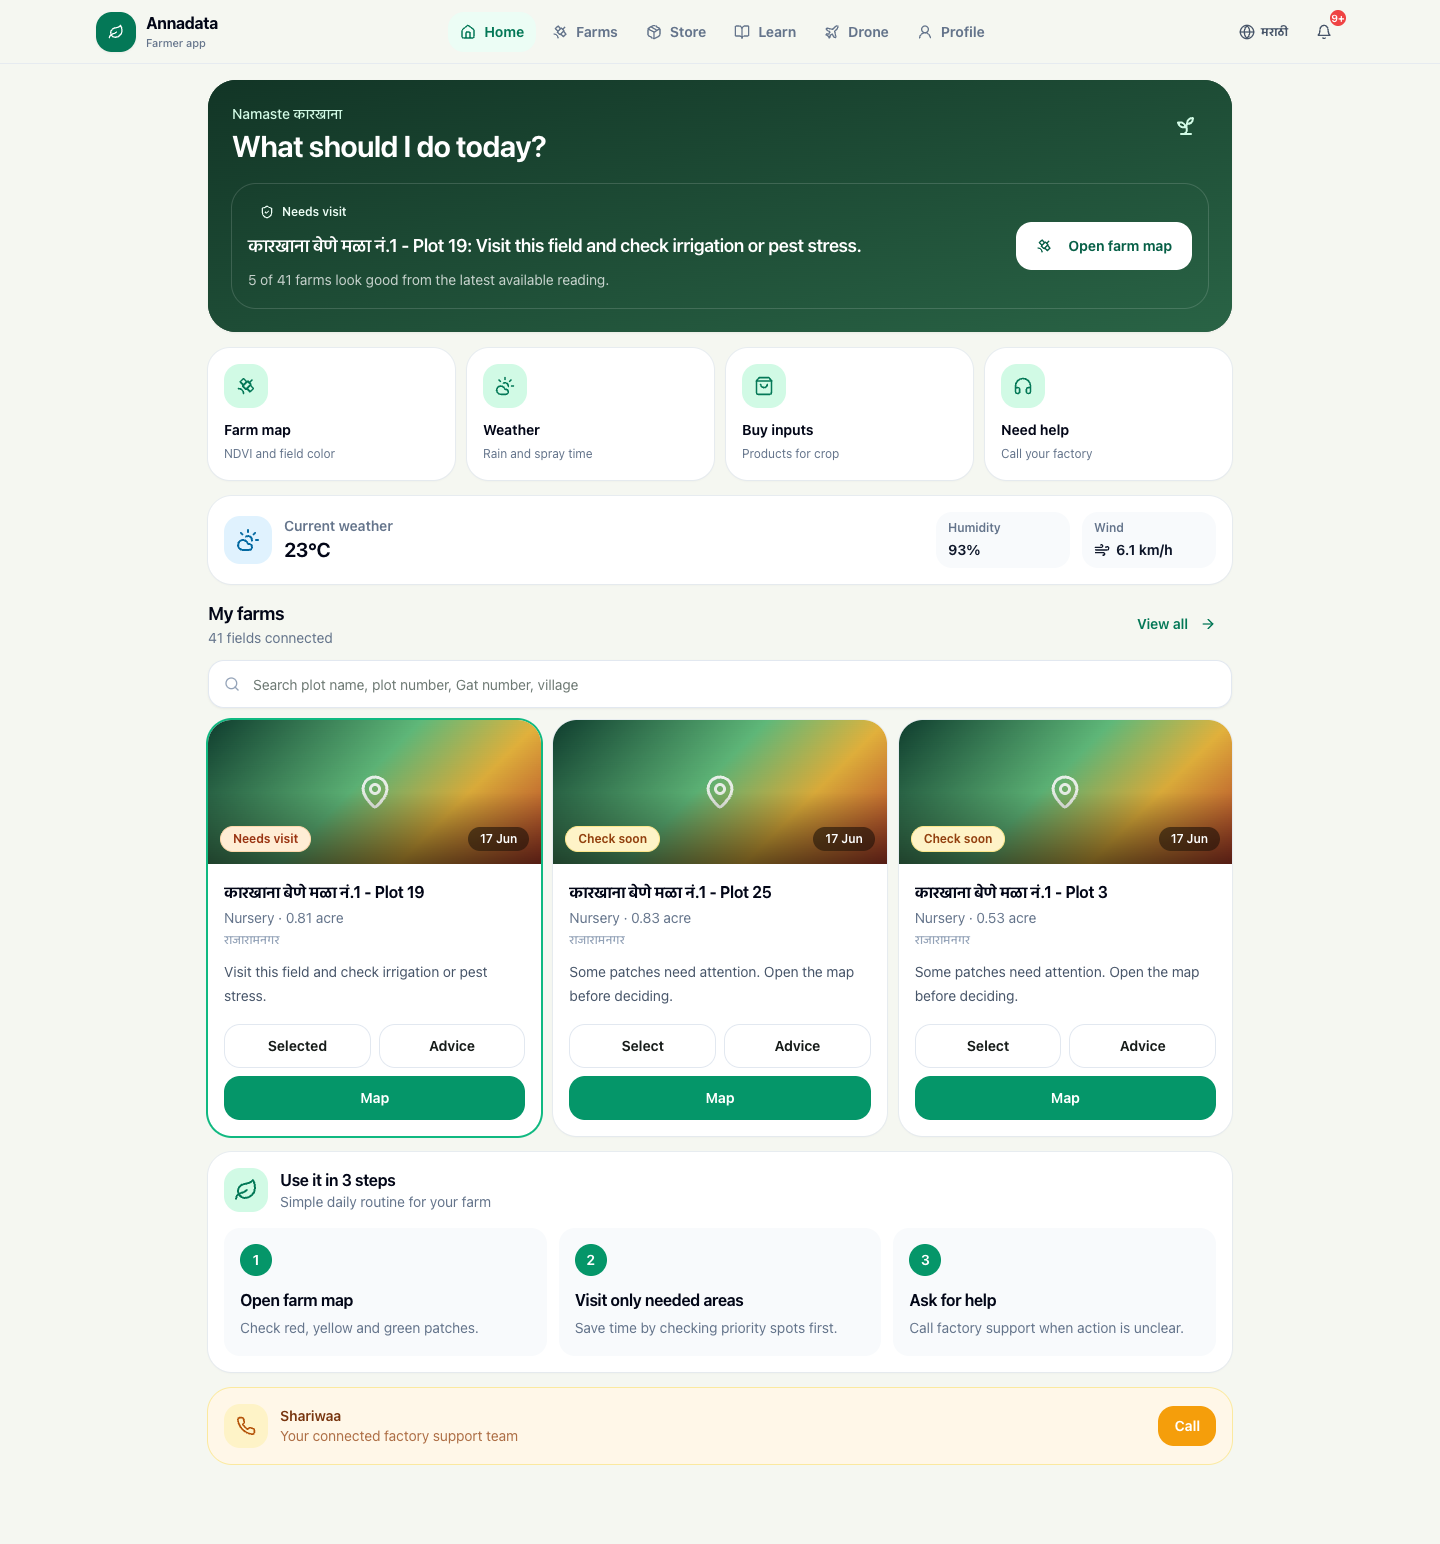
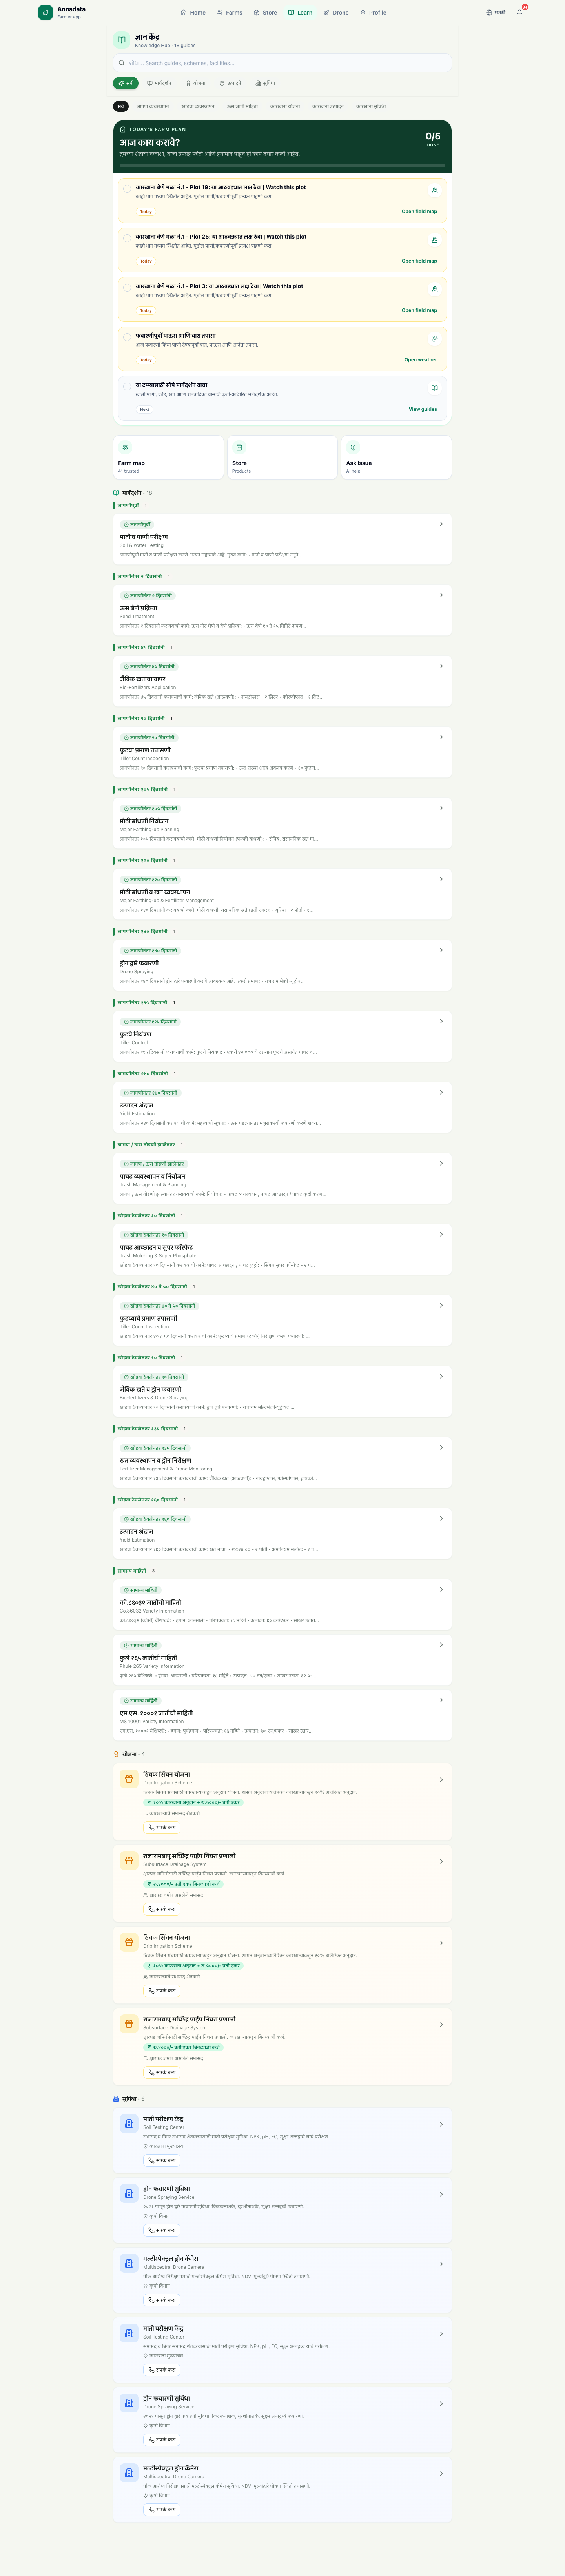
The dashboard opens with "What should I do today?", highlights fields needing visits, shows current weather, and keeps farm map, weather, crop inputs, and factory support one tap away.
A sugar factory operating layer that turns satellite NDVI, weather, crop stage, and agronomy logic into farmer action and factory visibility.
The real problem was not data. It was turning field signals into decisions a farmer could use today.
Sugar factories already manage farmer onboarding, plot records, crop stage, field visits, input guidance, harvest planning, weighbridge movement, payments, and season reporting. The effort exists. It is simply spread across registers, calls, memory, and disconnected software.
Annadata makes this work readable. The farmer does not need to understand satellite imagery or model logic. The farmer needs to know which plot needs attention, whether spraying is sensible, which input is suitable, and when to ask the factory for support.
The interface turns technical signals into field action while keeping the factory close to what is happening across villages and plots.
These screens were captured from the farmer account supplied for review. They show today's action, field map, crop inputs, learning, drone service requests, and profile acreage.
The case uses product evidence, not polished dashboard mockups.
Satellite readings, weather conditions, plot boundaries, crop stage knowledge, farmer requests, and factory support were not naturally becoming one clear daily routine.
The app connects field maps, NDVI style health readings, weather, crop stage guidance, product recommendations, farmer learning, and support requests into one farmer facing workspace.
What matters: the farmer is not asked to decode a complex model. The interface explains where attention is needed and keeps the next useful action close.
The farmer profile holds plot level reality: fields, acreage, village context, crop variety, and boundary status. In the inspected account, 41 fields and 28.5 acres were visible.
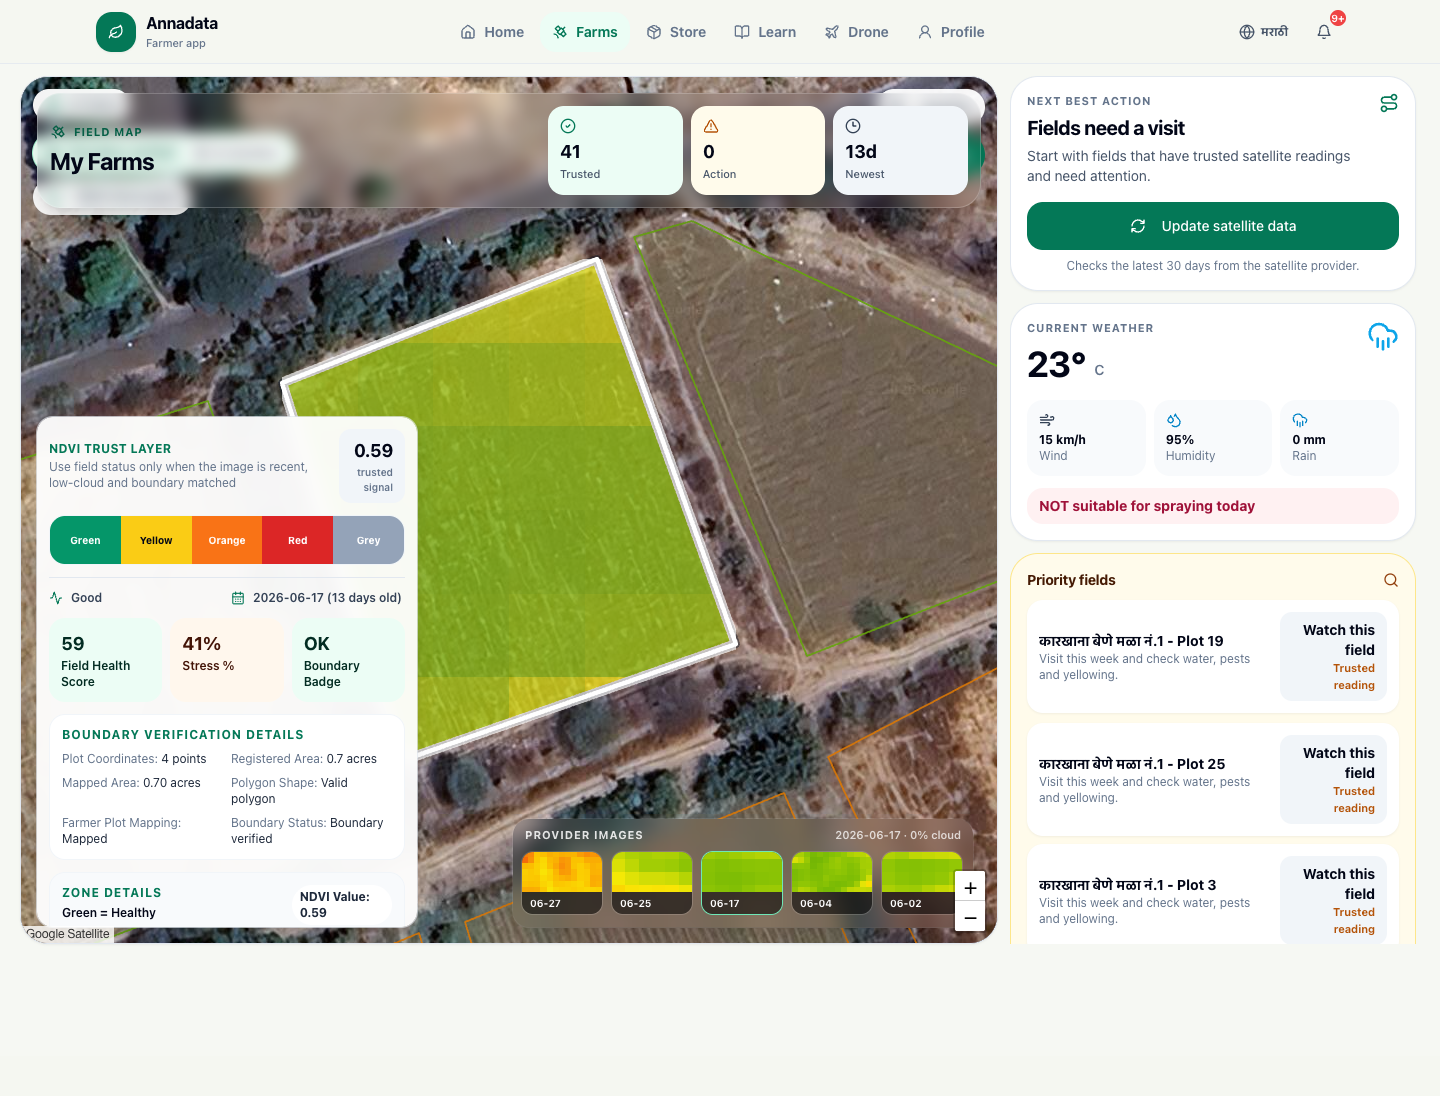
Recent provider images are checked for date and cloud conditions. The field map presents NDVI style zones, field signal, health score, stress percentage, and boundary verification.
Weather is brought into the decision layer: temperature, wind, humidity, rain, and suitability warnings help decide whether spraying or field activity should happen now.
Field status, crop stage, weather, and advisory logic are translated into simple next steps such as visit this plot, check water or pests, wait, spray, or continue normal care.
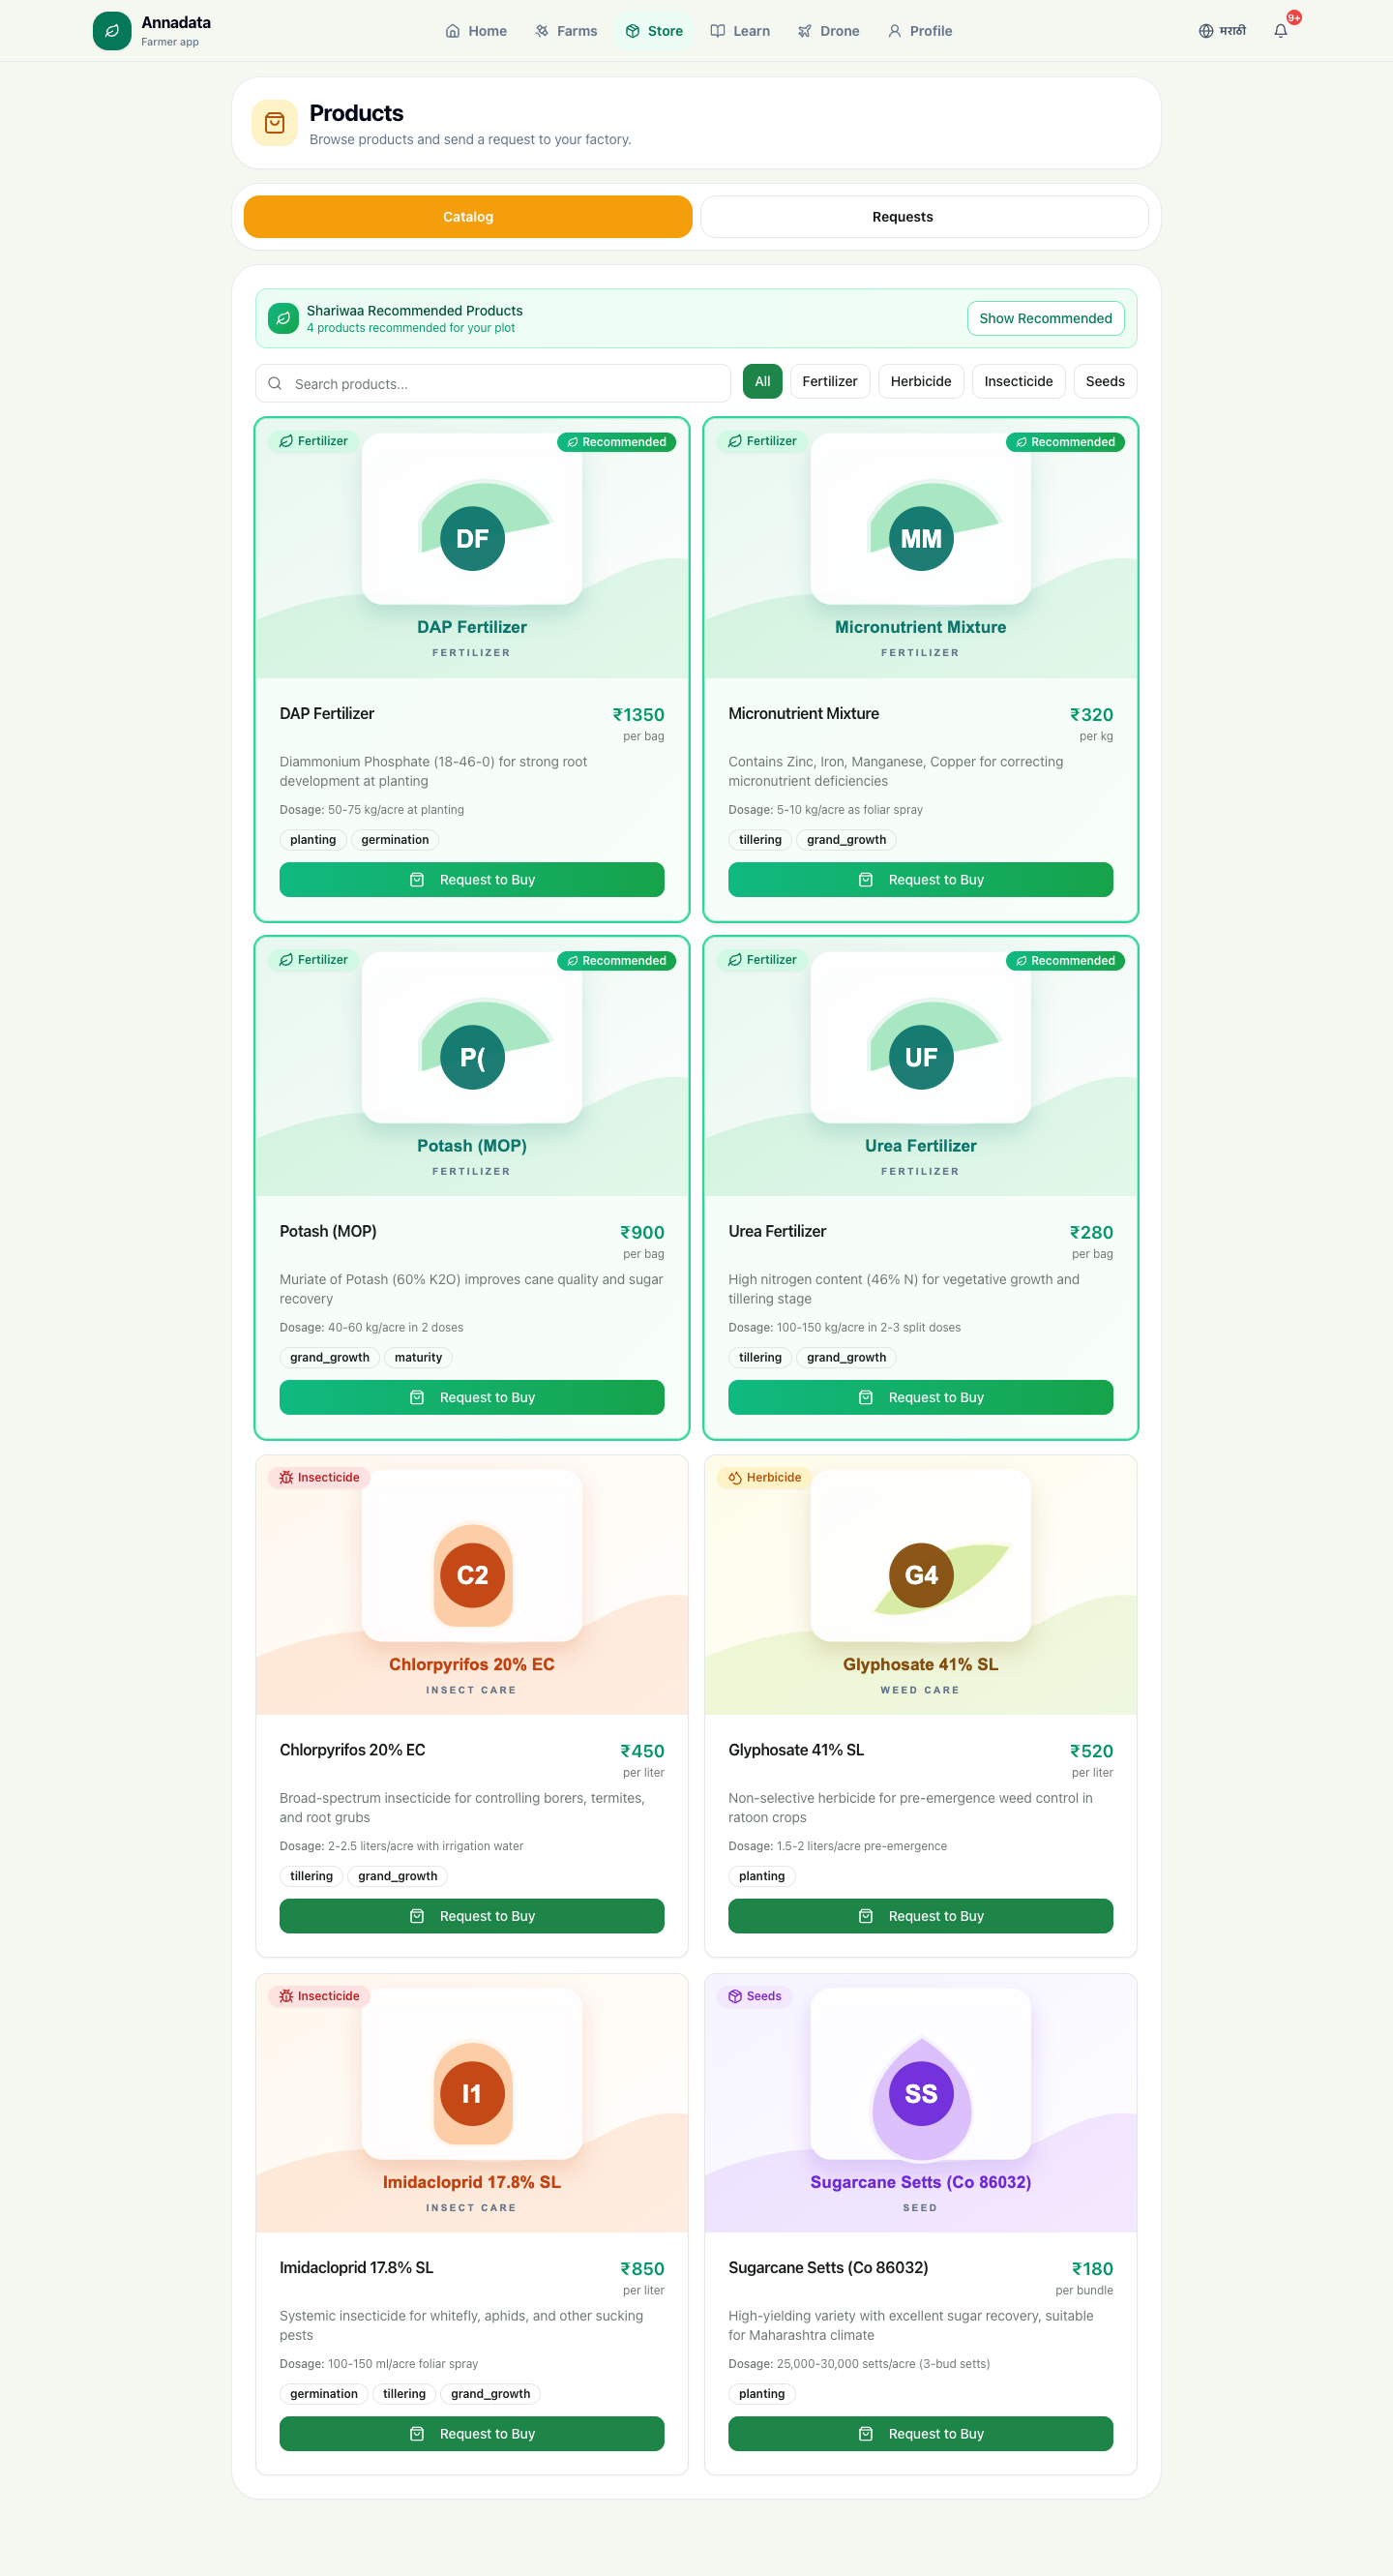
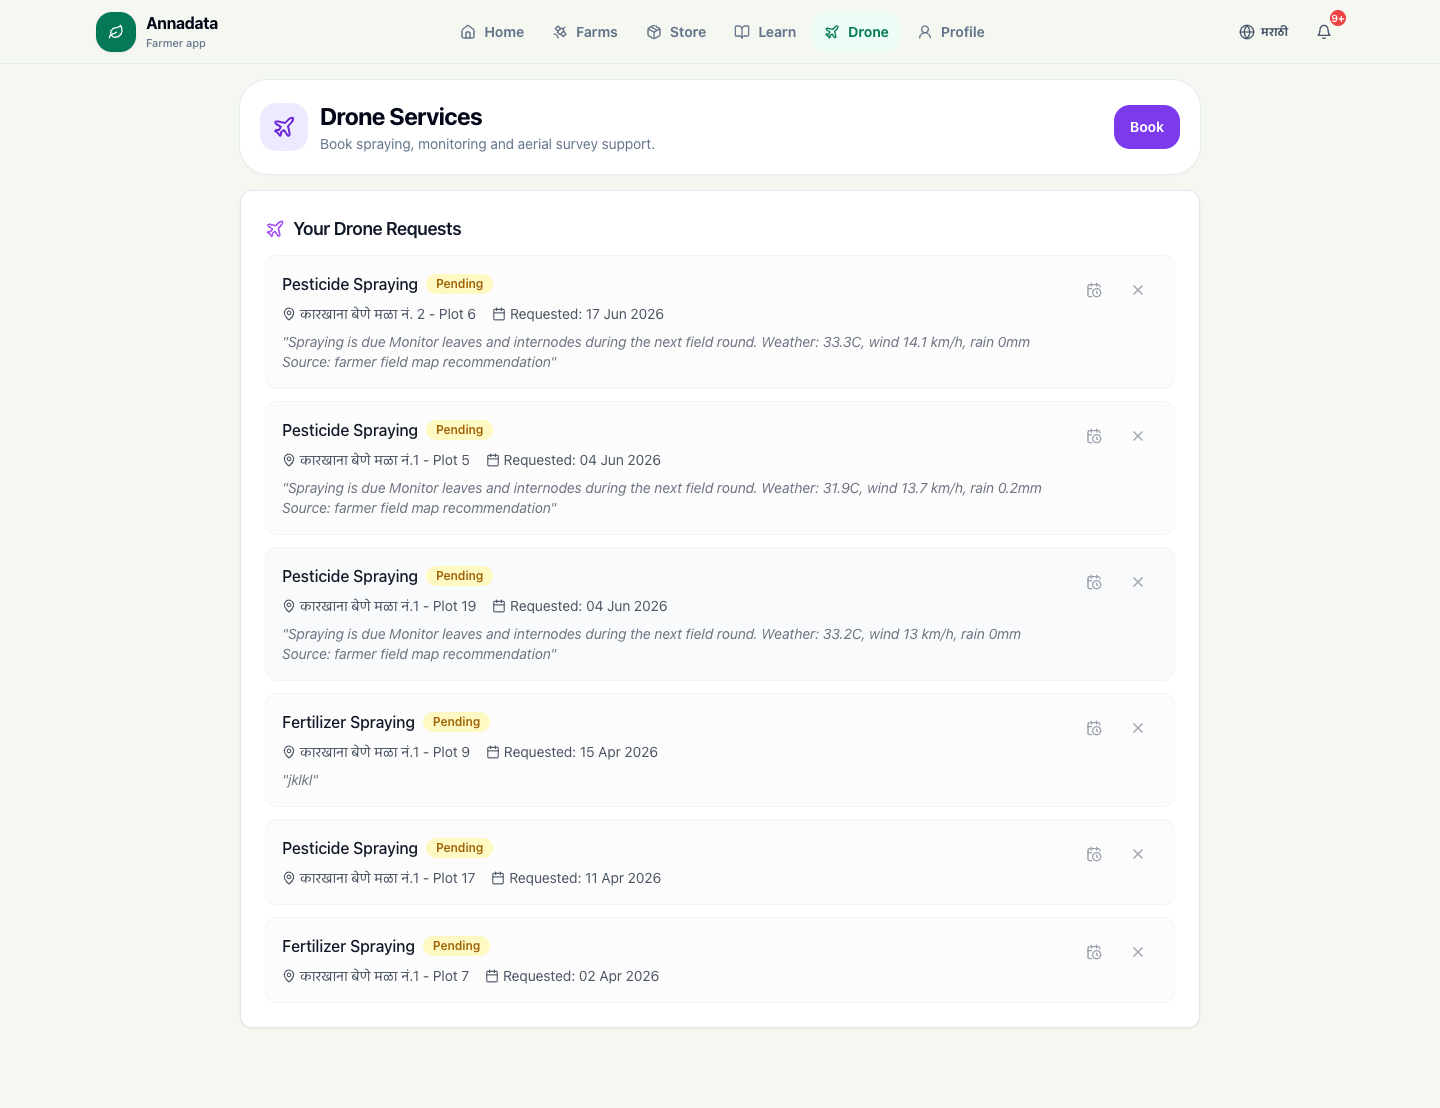
The recommendation does not end as text. It connects to product recommendations, knowledge guides, factory help, and drone service requests where a farmer needs execution support.
The dashboard opens with "What should I do today?", highlights fields needing visits, shows current weather, and keeps farm map, weather, crop inputs, and factory support one tap away.
The farmer can see boundary verification, image date, cloud percentage, NDVI legend, field health score, stress percentage, and specific zone guidance before deciding what to do.
Recommended products are visible by plot context, including fertilizers, micronutrients, insecticides, herbicides, and dosage guidance, with request to buy flow for factory handling.
Drone service requests show spraying tasks linked to plot, date, weather, and the source recommendation from the farmer field map. This is where advice becomes operational movement.
Field, acreage, village, crop stage, and farmer profile give the signal a real operating context.
NDVI, cloud, date, boundary, health score, and stress readings make the field condition inspectable.
Rain, wind, humidity, and temperature guide whether action should happen now or wait.
The interface converts the evidence into visit, inspect, input, spray, or support guidance.
Products, knowledge, factory help, and drone requests give the recommendation somewhere to go.
We do not present this as magic. That is what makes it more believable.
The system organizes field intelligence and improves timing, but crop decisions still depend on field reality, farmer observation, factory agronomy judgment, and adoption discipline. A red or yellow signal is a prompt for attention, not a substitute for inspection.
That boundary matters. Serious buyers do not trust exaggerated AI claims. They trust systems that show inputs, confidence signals, recency, weather context, and where human judgment remains in control.
The strongest claim is not a yield promise. The defensible claim is better timed, better informed field decisions.
Qualified prospects can review the live farmer flow with masked farmer details: dashboard, farm map, NDVI interpretation, weather context, input recommendations, knowledge guides, drone service workflow, and the operating rationale behind the product.
Daily action before technical data.
Boundary, health, stress, and recency visible together.
Inputs, learning, help, and drone requests connected to field context.
Signals can inform support, season planning, and service queues.
A walkthrough can show the actual interface logic, masked farmer views, and implementation reasoning without exposing sensitive client data.